Eyes, JAPAN
Safecast Hackathon 2018
HeisePhilipp
Introduction
Safecast has volunteers all over the world who work on the project. Every year, Safecast holds a Hackathon, where some of them meet at their office in Shibuya, Tokyo and work together. This year was not different. From the 29th of November to the 7th of December, people from America, Germany, Japan and many more gathered together, set up goals and tried to get things done. In this Blog I will go over my experience at the Hackathon and go more into detail at my task at the event.
Safecast
![]()
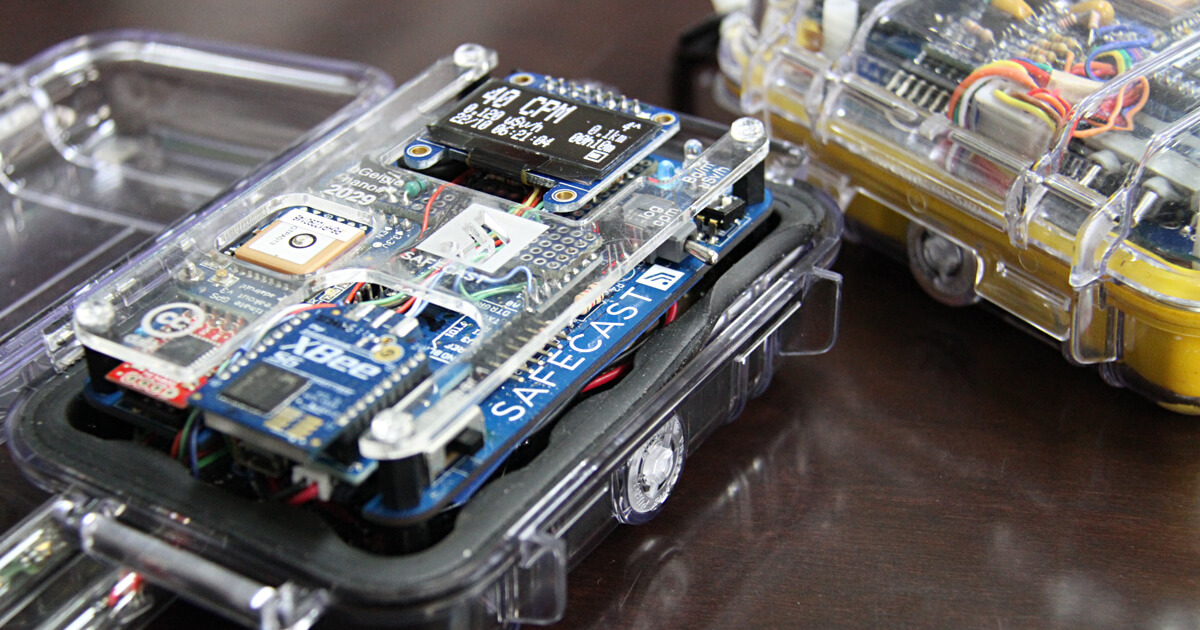
But before I start, some of you maybe have the question: What is Safecast?
To explain what Safecast is, I think the best way to start is to take a quote from the official website: “Safecast is an international, volunteer-centered organization devoted to open citizen science for the environment” ( Extracted from: Safecast: ABOUT SAFECAST, https://blog.safecast.org/about (2018.12.12) ).
Safecast was founded in 2011, right after the big earthquake and the meltdown of the Fukushima Daiichi Nuclear Power Plant. At that time, there was no easy way to get some radiation data. Because of that, the founders took it into their own hands, build a geiger counter and measured for themselves. Today, Safecast has over 111.000.000 measurements in their database, gathered from people all over the word. Everything is open source, that means everyone can easy view the data within the Safecast-Map or get the data for research for free.
Event Organisation
The Hackathon was held from Friday the 30th of November 2018 to Friday the 7th of December 2018. Some only participated for the weekend, some went home at some day within the week and some stayed until the end. Because of that, we tried to get the basic implementations done within the weekend. But not everyone worked on the same project. We split into five teams, each team had its own goal. There were a team for:
- Website
- API
- Visualization
- Raku
- Asia
Because of some similarities, some of the teams could work closely together, while others worked separate. I was part of the API team, so I will only cover what we achieved in this week.
Implementation
Weekend
After a short introduction, we got into our groups and hold a meeting. There we discussed the goal and who was responsible for what task. Our goal was, to make solarcast (“ingest”) data readily accessible for researchers. For that, we used the website from AQMD (Air Quality Management District, https://xappprod.aqmd.gov/aqdetail/AirQuality/HistoricalData) as an inspiration source. We thought that this would be the best way for researchers to get on the data. We wanted to make a page like this, only with the ingest data.
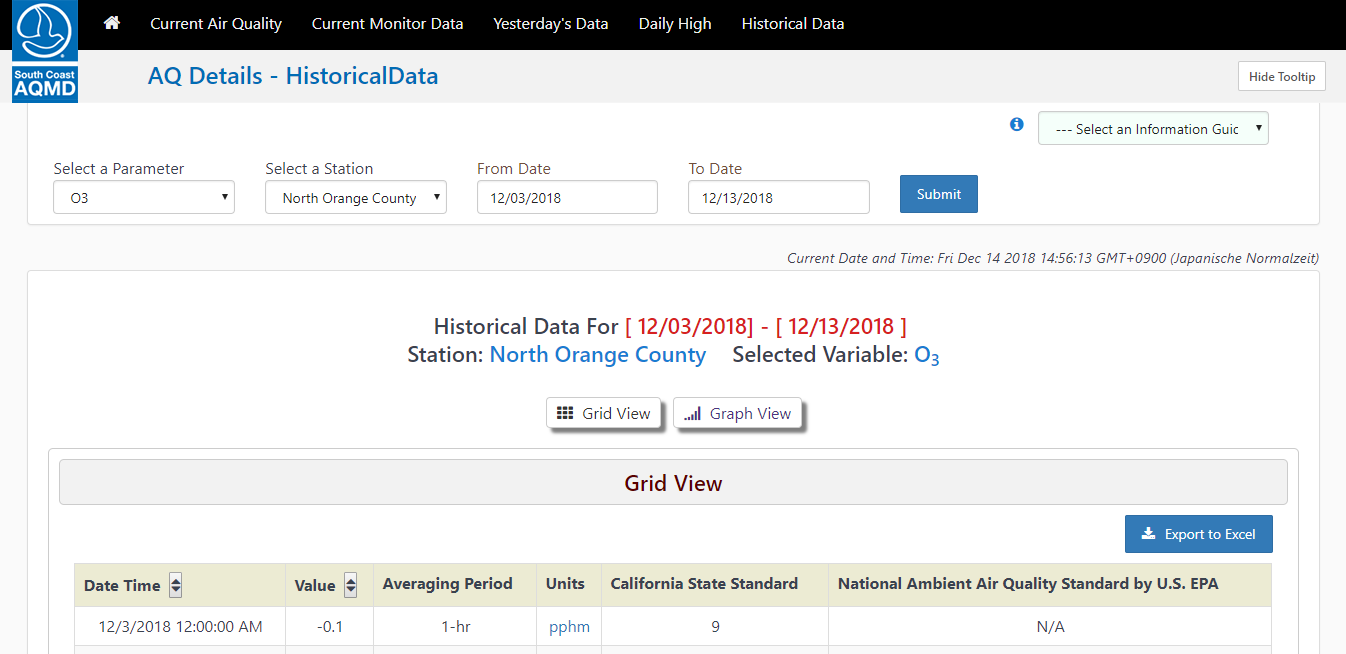
Site from AQMD we used as an inspiration
We brainstormed a little bit, what kind of information we need and what kind of filter option we want to provide. We decided that we need basically the same filters as AQMD. That meant we need a filter for the field, the area and the date. For the data we wanted to display, we decided to go with just the date, the value and the device ID from the device where this measurement comes from. After that, we got into the distribution of tasks. I was responsible for the front end. That means, I needed to make the view which is later visible to the user. On that day, I quickly implemented some basic layout structure. It was just a static html webpage with a form and a table where we could put in the data later.
For Saturday, the goal was to get some data into the view. While the other members of my team worked on enabling the database connection, I did some preparations for that in the view. But right at the beginning we hit a first wall. To get the data, we need a specific device id or multiple device ids. That means, for every area we wanted to display we needed all the device IDs. Also, we only wanted to show the area name in the selection field. We brainstormed a little bit what would be the best solution. The solution we came up with was quick and dirty, but as we wanted to get it done in the week, so we decided we will do it this way. We hardcoded a hash of selection possibilities into the view and in our controller, we mapped the parameter we got from that selection to an array of device IDs. The array of device IDs we hardcoded as well.
For the areas we decided to go with:
- Fukushima
- Central Japan
- Washington
- Boston
- Southern California
- San Jose
The next wall was a little bit more complicated. I use a windows pc and with that, we had some trouble establishing a connection. But after some try and error, we managed to get one. At that time, the query to get a hash with all the important data was already implemented into the model, so I only needed to use it. In the end we could see some data in the view, if only very provisionally. But we managed to finish our goal and got a first prototype.
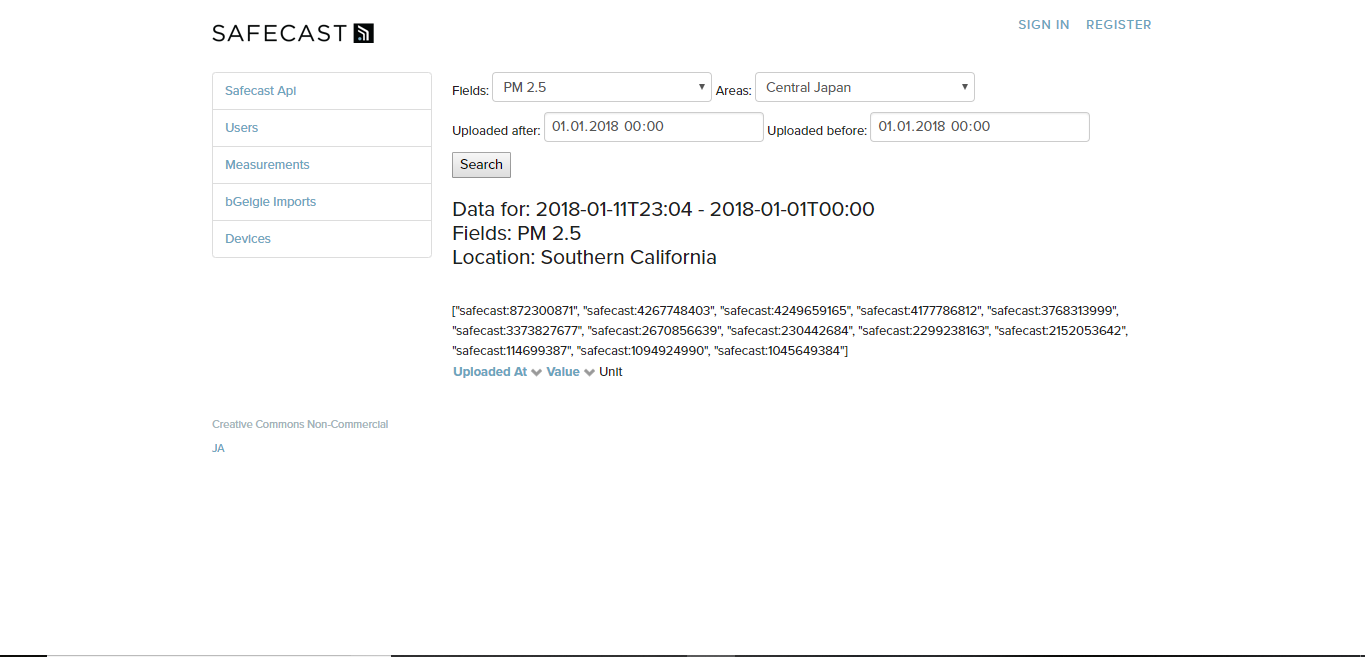
Prototype Version 1
As you can see, this is only a prototype. It still has debugging stuff in it and no design at all. Also, the selection of the field and filtering for the date didn’t work in that build and it wasn’t possible to export the data at all. For the field, the value of PM 2.5 was also, for the purpose of getting this prototype, hardcoded.
On Sunday, the first people started to go home. The goal of this day was to get the export of the CSV-file running. The export of the data is probably one of the most important features of that side. Without that, researchers would need to manually get the data out of the view, which would be very inconvenient. The export itself was not so hard to do, but before we could do that, I needed to create a CDV file out of the hash. With some help of a more experienced member of the team, I managed to get this done.
Weekdays
After the weekend, the most members of the API – Team went home. To get more clarity into the view, I searched for some already existing CSS-Classes for the table and the buttons and used them. I rearranged the form as well, so that the view looks a little bit nicer.
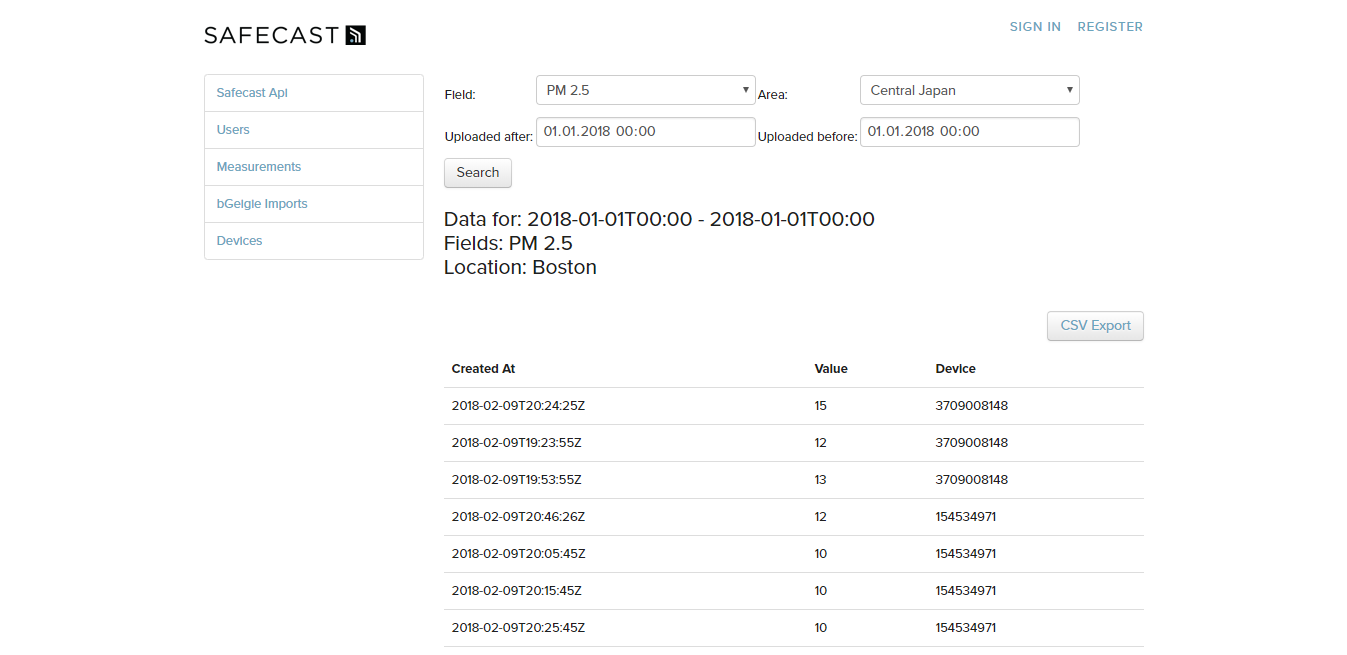
Protoype Version 2
As you can see, the second version looks way more clearly and now has a CSV-Export Button, which works as intended. But this version still only supports the PM 2.5 field, which was hardcoded. For the next step, I tried to get as much fields in there as I could. The visualization team worked on a new way to visualize the ingest data. Because of that, I got a rough idea about the important fields and only needed to find the names in the hash. After that, everything was easy because I only needed to change the strings into some variables. The field we use are:
- OPC PM 1.0
- OPC PM 2.5
- OPC PM 10.0
- PM 1.0
- PM 2.5
- PM 10.0
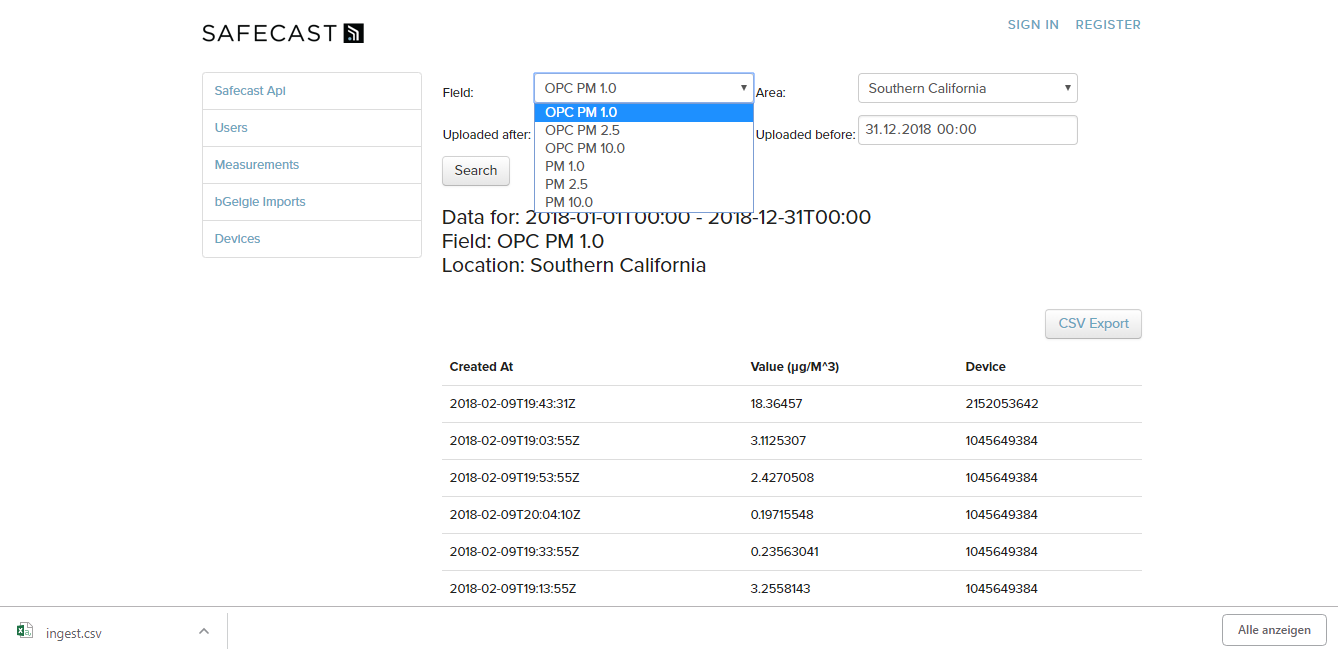
Prototype Version 3
The next step was the filtering for the date. After some collusion with the API Team, we decided to do the filtering in the controller and not in the model, at least now. The last step that needed to be implemented was to link the page within the navigation menu, so everyone can enter it. After that, every feature was implemented, and I went to some bug fixing. I found some Null Pointer Errors that were triggered under certain circumstances and fixed that.
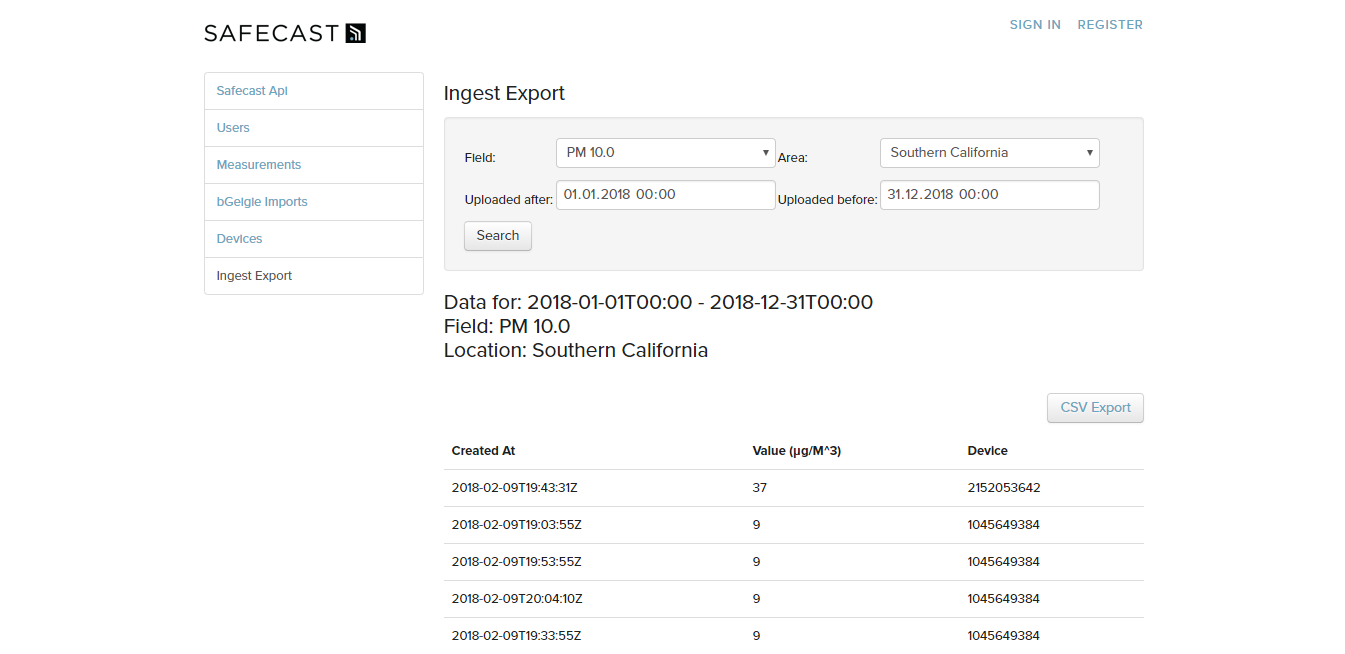
Final Verson
On Tuesday morning, I made my long way back to Aizu
Conclusion
The week was stressful, loud, everything was narrow and full of people. Besides that, and maybe because of that, I enjoyed it a lot. It was nice to meet all the people in person, who I only knew online. Everyone was friendly, and it was fun working with them and exploring Shibuya together. We worked hard, but in the end, I think we managed to get some good results. Overall it was a great experience and I thank Safecast for the great week and for giving me the opportunity to participate.
- Tweet
-

 2024/03/26
 2024/02/27
 2024/02/23
 2024/02/09
 2024/02/02
 2024/01/23
 2024/01/12
 2024/01/05